What is MSMpred?
- Objective: fit and validate a multistate model and make predictions using it easily.
- Data: the user can upload data or use the
example data.
- Example data: example data comes from the DIVINE project.
Sections of MSMpred
- Data: upload new data.
- Model specification: define the transitions, choose the covariates and decide the follow-up time.
- Exploring the data: descriptive graphs of the data.
- Fitted model: choose the type of model and fit the model.
- Graphics: receive a forest plot of the fitted model.
- Model validation: validate the model using residuals.
- Predictions: make predictions about new individuals.
Warning!
If you have problems using it do not heasitate to contact us.
Leire Garmendia Bergés: leire.garmendia@upc.edu
Jordi Cortés Martínez: jordi.cortes-martinez@upc.edu
Matilde Francisco: matilde.martins.da.palma@upc.edu
Guadalupe Gómez Melis: lupe.gomez@upc.edu
A new version of MSMpred can be found at: https://www.grbio.eu/pubs/MSMpred2/
DIVINE
- Team: clinicians from Instituto de Investigación Biomédica de Bellvitge (IDIBELL) and biostatisticians from Universitat Politècnica de Catalunya (UPC).
- Data: more than 4,000 hospitalized adult COVID-19 patients from 8 Catalan hospitals during four waves of the pandemic.
- Objectives:
- Identify the most clinically relevant prognostic factors for the events.
- Develop a prediction tool to identify high-risk individuals.
- Estimate the incubation time period of the SARS-CoV-2.
- Assess the patients’ profile over time.
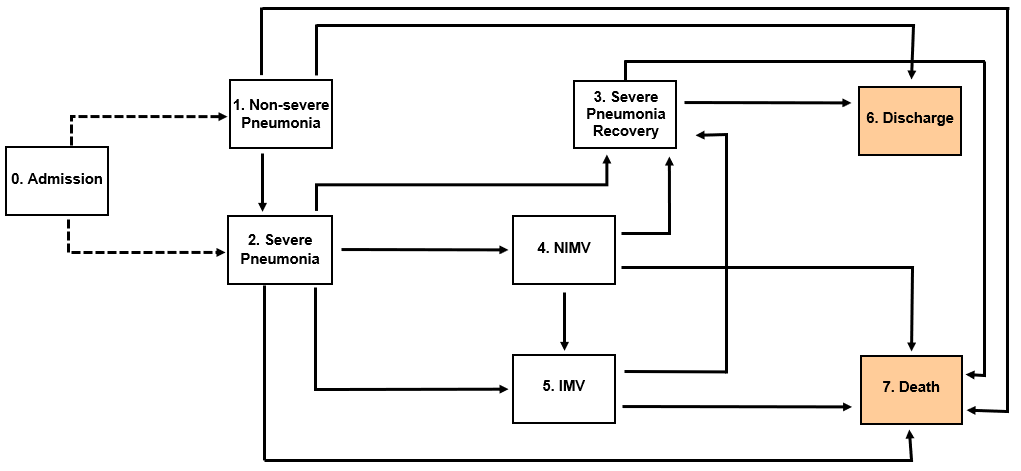
States
- No severe pneumonia (nopneum): patients that are hospitalized due to COVID-19 but do not have severe pneumonia.
- Severe pneumonia (pneum): patients that are hospitalized due to COVID-19 and have severe pneumonia.
- Recovery (reco): patients that had severe pneumonia while hospitalized due to COVID-19, and follow at the hospital but they have recovered.
- Non-invasive mechanical ventilation (NIMV): patients that need non-invasive mechanical ventilation while hospitalized due to COVID-19.
- Invasive mechanical ventilation (IMV): patients that need invasive mechanical ventilation while hospitalized due to COVID-19.
- Discharge (dcharg): patients that go home or to another hospital after recovering from COVID-19.
- Death (death): patients that die in the hospital due to COVID-19.
Transitions
Covariates
- Sex (sex): dicotomic covariate with categories Men and Women representing the sex of the patients.
- Age (age): numeric covariate that represents the age of the patients.
- Pneumonia severity index (psi): numeric covariate that represents the severity of the pneumonia.
- Cardiovascular diseases (card_vasc): a dicotomic covariate with categories No and Yes representing if the patients have any cardiovascular disease or not.
- blood oxygen saturation/oxigen supply (safi): numeric covariate that represents the respiratory limitations.
- Charlson index (charlson.fact): index that predicts 10-year mortality.
- C-reactive protein (crprot): a numeric covariate that represents the value of the C-reactive protein (CRP) of each patient.
- Lymphocytes (lympho): a numeric covariate that represents the number of lymphocytes of each patient.
File format
- Uploaded data needs to be a csv file where columns are separated by comas and decimals are represented by points.
States
- Time and status variables related to the different states of the model need to be called as x_time and x_status respectively, where x corresponds to the name of each state (e.g. death_time and death_status).
- The initial state(s) need to be included in the file following the previous naming and time equal 0 when the initial state is not a transient state.
- Data must include one variable named inistat where the name of the initial state of each individual is specified.
Covariates
- The variables that are not named as x_time, x_status, id or inistat will be considered as covariates.
- The names of the variables can not contain any number or dot.
Once a dataset is uploaded you need to refresh the page to use the example data.
When the DIVINE cohort is used for confidentiality reasons only the information of 20 patients is shown, although internally all the individuals are used.
Every time you add/delete a transition or covariate the app automatically makes the needed computations.
Orange → Initial state; Blue → Transient state; Magenta → Absorbing state; Green → Isolate state
Define the transitions
In order to include several covariates, transitions need a minimum of individuals for each covariate.
Multistate model diagram
Number of events for each transition
Time specification
Covariates per transition
Box-plots of the length of stay in each state
Cumulative incidence curves of the absorbing states
You can use the search box to find the covariates related with a specific transition.
1) Table of model coefficients:
2) Table of likelihood:
3) Table of goodness of fit:
Forest plot of the covariates taken into account in the selected transition
Martingale-based residuals of the selected covariate and transition
dfbetas residuals of the covariates related with the selected transition
Schoenfeld residuals of the covariates related with the selected transition
The predictive performance is not computed automatically as it takes to much time. If wanted this performance can be computed clicking on the button.
Table of logarithmic score:
Confusion matrix:
Table of model comparison:
Save the models:
Save the following session id to use it to upload this information in other session:
Load other models:
Introduce the session id you want to recover:
You can predict the clinical evolution for new individuals, using the model previously fitted. This prediction can be done for one or two individuals at the same time, making possible the comparison of the evolution of individuals with different profiles.
Every time you add/delete a transition or covariate the app automatically makes the needed computations.
GRBIO
Funding


Authors

Leire Garmendia Bergés

Jordi Cortés Martínez

Guadalupe Gómez Melis
